A bit of fun!
Here is a java applet that traverses the html of a webpage and turns it into a stunning visual graphic. A more detailed on-line explanation and examples found here.
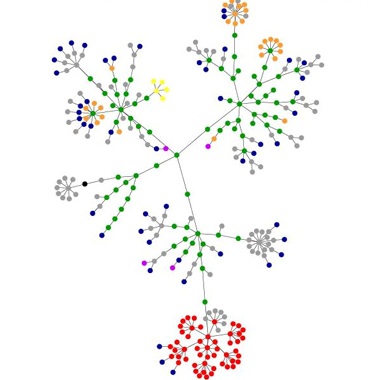 Screenshot of Photographs Do Not Bend (above). Create your own.
What do the colors mean?
blue: for links (the A tag)
red: for tables (TABLE, TR and TD tags)
green: for the DIV tag
violet: for images (the IMG tag)
yellow: for forms (FORM, INPUT, TEXTAREA, SELECT and OPTION tags)
orange: for linebreaks and blockquotes (BR, P, and BLOCKQUOTE tags)
black: the HTML tag, the root node
gray: all other tags